|
Topics: Οργανωσιακή Θεωρία και Συμπεριφορά (Organizational Behavior), Επιχειρηματικότητα (Entrepreneurship), Εταιρική Κοινωνική Ευθύνη (Corporate Social Responsibility), Strategic Management, Leadership , Organizational Culture and Change
Τρίτη 27 Μαρτίου 2018
the increasing use of smart speakers (statista)
Σάββατο 24 Μαρτίου 2018
THE CITIES WITH THE HIGHEST COST OF LIVING (STATISTA)
|
Dropbox Gets Ready To Go Public (cBinsights)
|
Πέμπτη 22 Μαρτίου 2018
ΟΙ ΜΕΙΩΣΕΙΣ ΜΙΣΘΩΝ ΣΕ ΕΛΛΑΔΑ ΚΑΙ ΑΛΛΕΣ ΧΩΡΕΣ ΤΗΣ ΕΕ. Wage Squeeze in EU countries
|
Δευτέρα 12 Μαρτίου 2018
Σάββατο 10 Μαρτίου 2018
Πέμπτη 8 Μαρτίου 2018
The Tech World Is Still a Man's World
|
Τετάρτη 7 Μαρτίου 2018
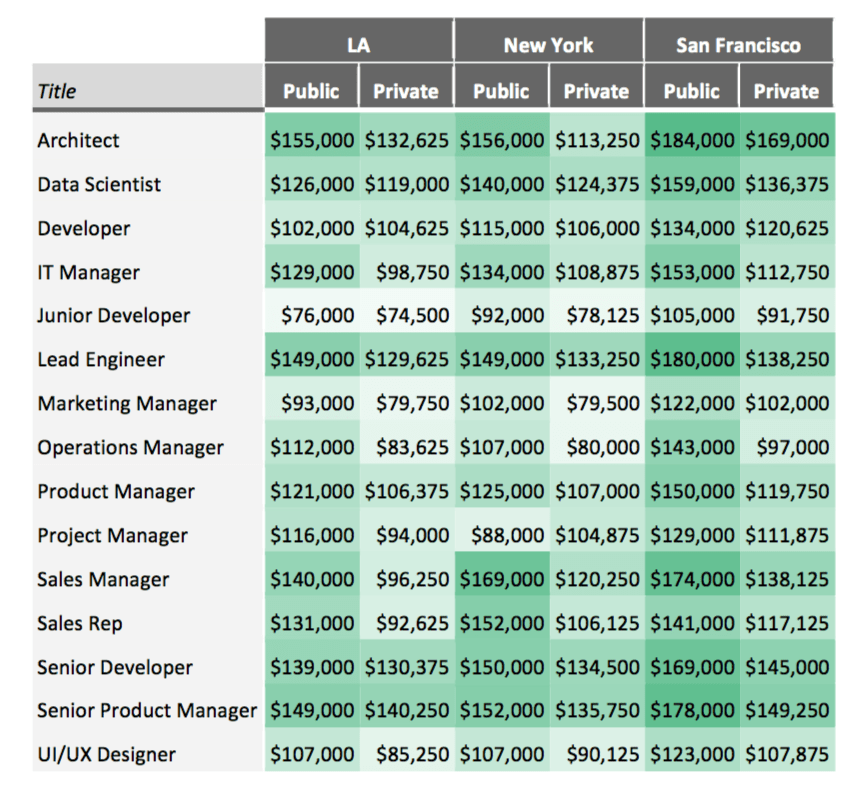
These tech jobs can earn you the most money
In order to best negotiate your salary, being equipped with the knowledge of what other people are making can be immensely helpful. Generally speaking, you’re going to earn more money working at a public tech company versus a private tech company, according to new data from culture workplace and salary comparison platform Comparably. And the bigger the company, according to Comparably’s data, the more money you’ll make.
A senior developer at a private tech company with little funding earns about $73,000 a year while a senior developer at a public company earns an average of about $130,000. No matter where you work, however, you’re going to make the most money as an architect or senior product manager, according to Comparably.
Δευτέρα 5 Μαρτίου 2018
Elite colleges that enroll the highest percentage of low- and middle-income students (NYTimes March 5 2018)
Elite colleges that enroll the highest percentage of low- and middle-income students
COLLEGE | PCT. FROM BOTTOM 40% | |
---|---|---|
- | Bernard M. Baruch College | 40.6 |
1. | University of California, Los Angeles | 19.2 |
- | Rutgers University | 16.8 |
2. | Emory University | 15.9 |
3. | Barnard College | 15.3 |
4. | New York University | 14.3 |
5. | Vassar College | 13.8 |
6. | Bryn Mawr College | 13.7 |
7. | Massachusetts Institute of Technology | 13.5 |
8. | University of Miami (Fla.) | 13.1 |
Rankings are shown for “elite” colleges only.
Παρασκευή 2 Μαρτίου 2018
the Wearables Market (statista)
|
Πέμπτη 1 Μαρτίου 2018
High-wage earners have continued to pull away from everyone else since 2000
High-wage earners have continued to pull away from everyone else since 2000Cumulative percent change in real hourly wages, by wage percentile, 2000–2017
Year | 10th | 30th | 50th | 70th | 90th | 95th |
---|---|---|---|---|---|---|
2000 | 0.0% | 0.0% | 0.0% | 0.0% | 0.0% | 0.0% |
2001 | 2.9% | 3.0% | 2.6% | 2.0% | 2.8% | 1.8% |
2002 | 4.0% | 4.7% | 2.6% | 3.5% | 5.1% | 5.9% |
2003 | 2.8% | 3.2% | 4.3% | 4.7% | 5.2% | 4.1% |
2004 | 1.0% | 1.0% | 4.3% | 3.1% | 5.0% | 5.2% |
2005 | -0.7% | -1.6% | 3.3% | 2.8% | 5.0% | 5.6% |
2006 | 0.3% | 0.3% | 4.1% | 1.5% | 6.3% | 6.4% |
2007 | 2.3% | 1.0% | 2.3% | 3.4% | 6.9% | 8.6% |
2008 | 0.4% | 1.6% | 2.8% | 3.3% | 7.3% | 9.2% |
2009 | 1.0% | 2.5% | 4.8% | 6.1% | 10.5% | 11.1% |
2010 | 0.0% | 0.9% | 3.4% | 5.7% | 10.7% | 10.0% |
2011 | -2.4% | -0.9% | 0.5% | 3.0% | 8.3% | 9.1% |
2012 | -3.6% | -1.5% | 0.0% | 3.0% | 9.0% | 10.6% |
2013 | -2.5% | -2.4% | 0.7% | 3.5% | 9.8% | 12.2% |
2014 | -1.8% | -3.4% | 0.4% | 2.2% | 8.8% | 11.2% |
2015 | 1.9% | -0.7% | 1.7% | 5.8% | 13.0% | 17.7% |
2016 | 4.9% | 2.1% | 4.8% | 5.3% | 15.6% | 19.7% |
2017 | 8.9% | 4.1% | 5.0% | 7.1% | 17.9% | 21.5% |
Notes: Sample based on all workers ages 18–64. The xth-percentile wage is the wage at which x% of wage earners earn less and (100 − x)% earn more.
Source: EPI analysis of Current Population Survey Outgoing Rotation Group microdata
Εγγραφή σε:
Αναρτήσεις (Atom)